User Generated Content (UGC) Sampling Campaigns
01. Project introduction
When retailers want to increase or generate organic User Generated Content (UGC) for new products, Bazaarvoice will send products to targeted members in Influenster's 7.5M+ community (Influenster is another product in the Content Acquisition Services (CAS) portfolio). The objective of this is to influence or encourage more people to buy their products. Clients can use the Bazaarvoice network to specify a number of audience attributes, for example, where members live, their age or their gender. Members will leave reviews through the Members app.
02. The Problem
Campaign Setup
Previously, clients were required to complete a Microsoft Excel spreadsheet detailing:
- The products they wanted included in a campaign
- The demographics of the members they wanted to receive samples
This process was manual, time-consuming, and prone to inconsistencies.
Campaign Updates & Reporting
Today, BV admins manually:
- Provide clients with periodic campaign status updates
- Create end-of-campaign wrap reports in PDF or PowerPoint format
To do this, admins pull data from multiple internal data sources and apply standard templates to produce a client-facing report, which is then sent to clients as an email attachment.
Key Limitations of the Current Approach
This manual workflow introduces several significant issues:
- No real-time visibility:
Clients cannot view live or up-to-date campaign progress and must rely on manual updates from BV admins. - Delayed campaign wrap reports:
Clients often wait several weeks after a campaign ends to receive the final performance report. - Negative client perception:
The lack of transparency and delayed reporting contributes to the perception that Bazaarvoice campaigns take too long to generate reviews. This concern is frequently cited in:- NPS feedback
- Competitive losses to platforms such as Sozie
- High operational overhead for admins:
Admins spend a substantial amount of time manually creating reports for each campaign.
Operational Impact
Time Spent Per Campaign
On average, creating a single campaign wrap report requires:
- Pulling performance data: ~30 minutes
- Creating a client-facing PowerPoint: ~2 hours
Total: ~2.5–3.5 hours per campaign
Monthly Scale Impact
- Approximately 700 VoxBoxes and TryIts are run per month
- This results in:
- ~1,750 admin hours per month
- Equivalent to ~219 full workdays spent solely on campaign wrap reporting
This estimate does not include:
- RMS / BMS / NMS campaigns
- Ongoing status updates provided during the campaign lifecycle
03. Discovery and Research
User Interviews
I conducted in-depth user interviews with 10 of our most engaged clients, all of whom are FTSE 100 companies. The goal was to understand how clients currently evaluate sampling campaigns and where the experience falls short.
Research synthesis
The following themes emerged consistently across client interviews:
1. Real-time visibility and control
Clients need a live overview of performance so they can:
- Update internal stakeholders with confidence
- Make informed adjustments mid-campaign, such as refining or expanding audience demographics if review quality is not meeting expectations
2. Preference for clear, direct metrics
Clients prefer straightforward, quantitative data over narrative or storytelling-style insights.
They want metrics that are:
- Easy to understand at a glance
- Simple to export as a PDF for sharing
3. Campaign organisation and status clarity
Clients want to clearly separate campaigns by status:
- In progress
- Completed
This helps them quickly identify what needs attention and what is ready for evaluation.
4. Modern and intuitive experience
There is a strong expectation for a modern, engaging interface.
The experience should be:
- Easy to navigate
- Designed for quick scanning rather than deep exploration
5. Outcome-focused reporting
Clients want to immediately understand results and impact.
Because they set up campaigns themselves, they are:
- Less concerned with configuration details
- More focused on performance and outcomes
6. Shareable, executive-ready outputs
Clients need to:
- Download a clear PDF of campaign outcomes
- Demonstrate return on investment and value to senior stakeholders, especially during budget renewal conversations
7. Social content as a quality signal
For Sampling campaigns, social media performance is not a primary success metric.
Member-uploaded images are mainly used to:
- Identify potential product faults
- Surface quality or usage issues early
When deeper social analysis is required, clients referenced Traackr as a strong example of a tool for understanding engagement and reach.
Key takeaways
Clients are looking for a results-first, transparent and efficient experience that:
- Provides real-time visibility
- Emphasises outcomes over setup
- Reduces the effort required to extract and share insights
- Supports both day-to-day campaign decisions and executive-level conversations
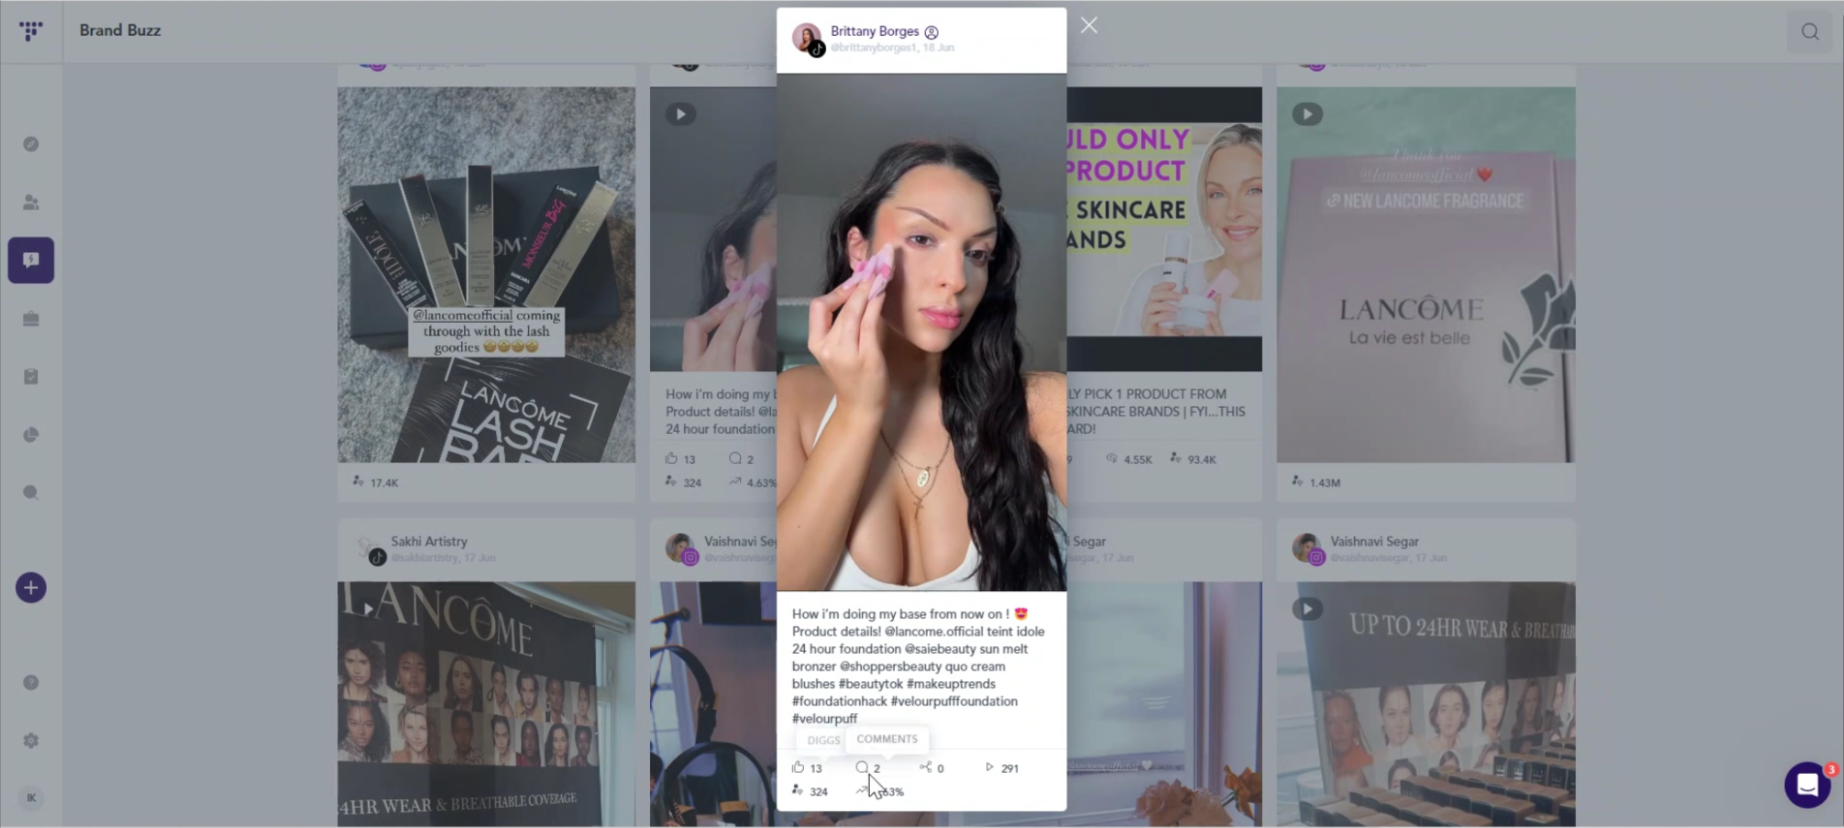
An example of a sampling campaign posted on Instagram
04. Solution
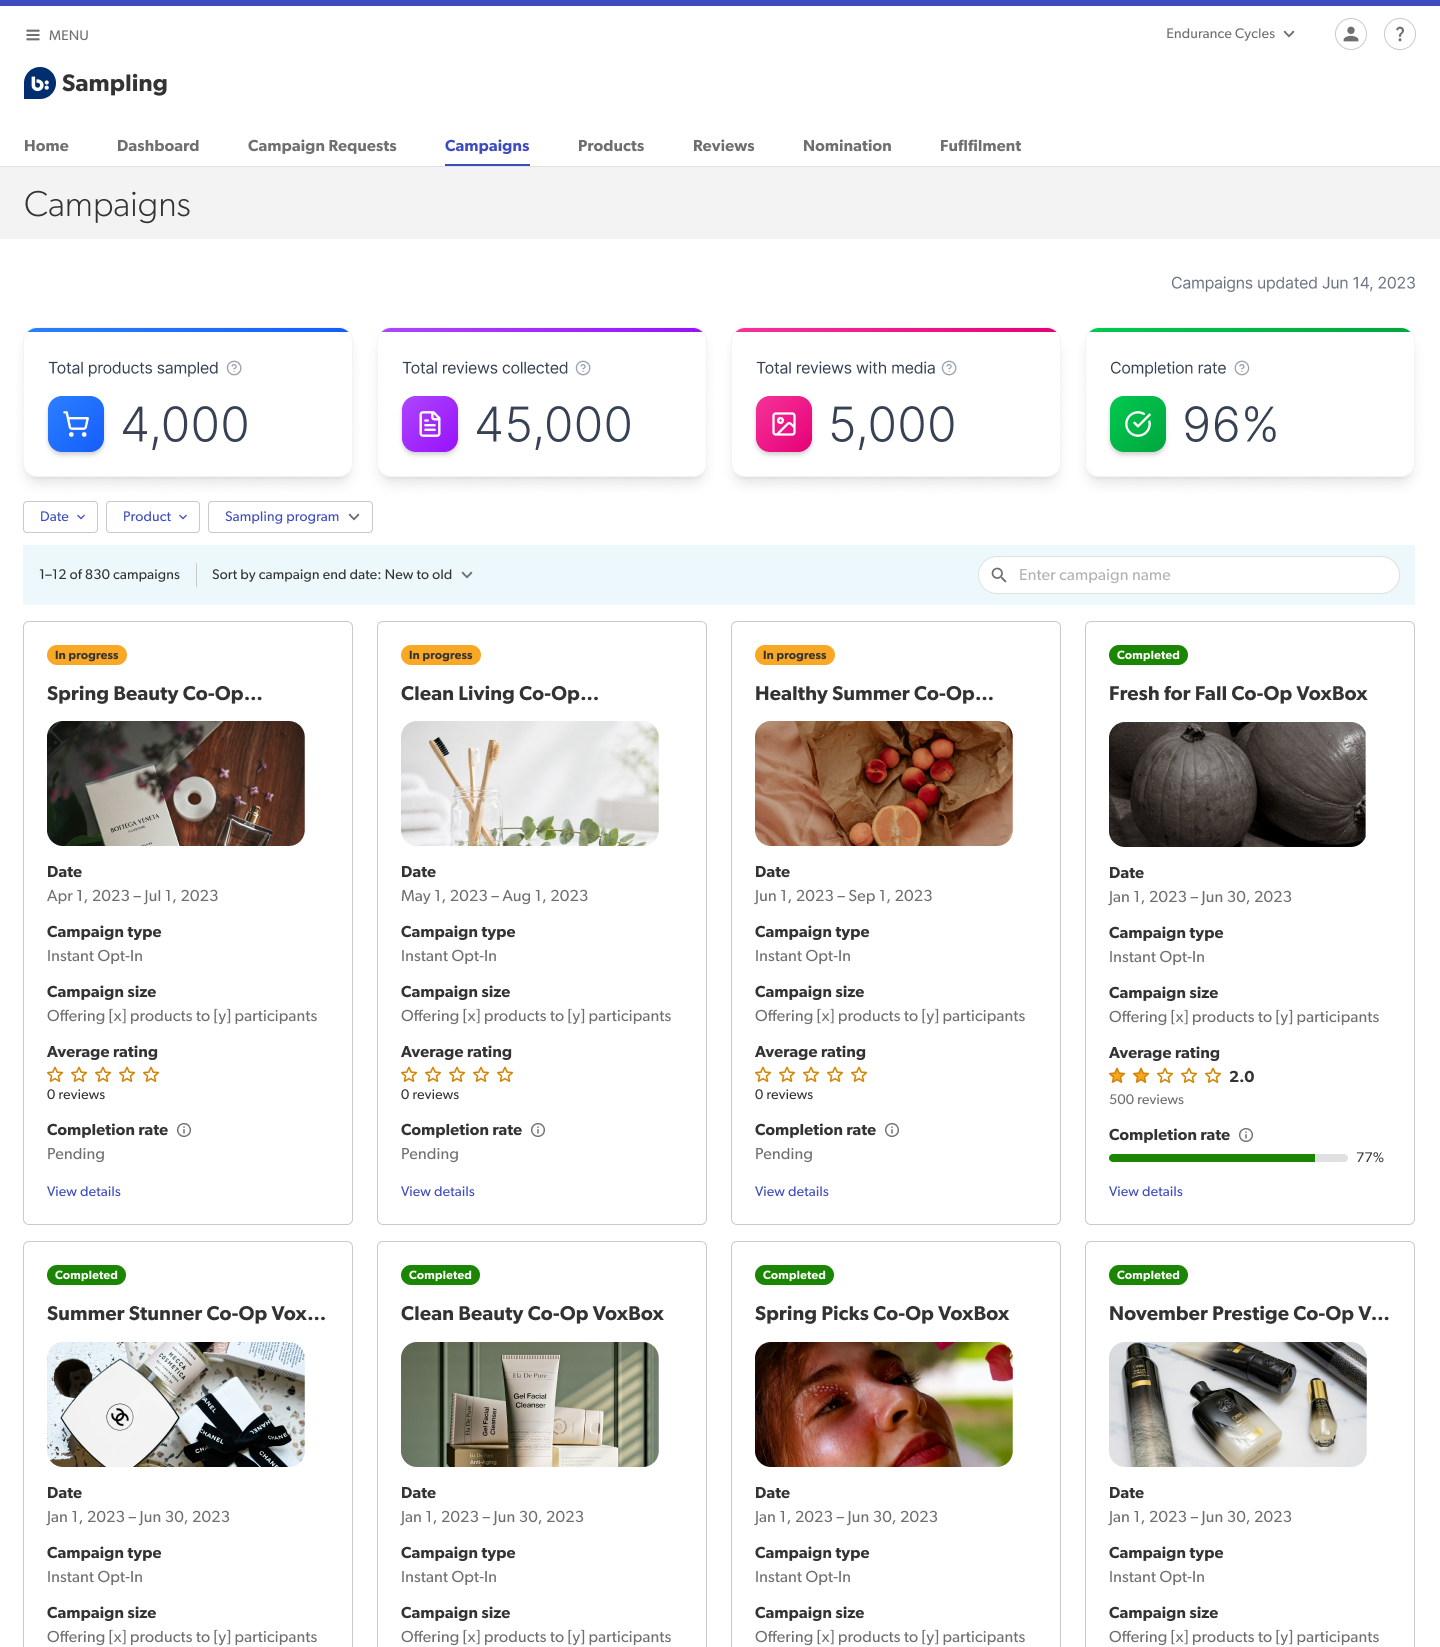
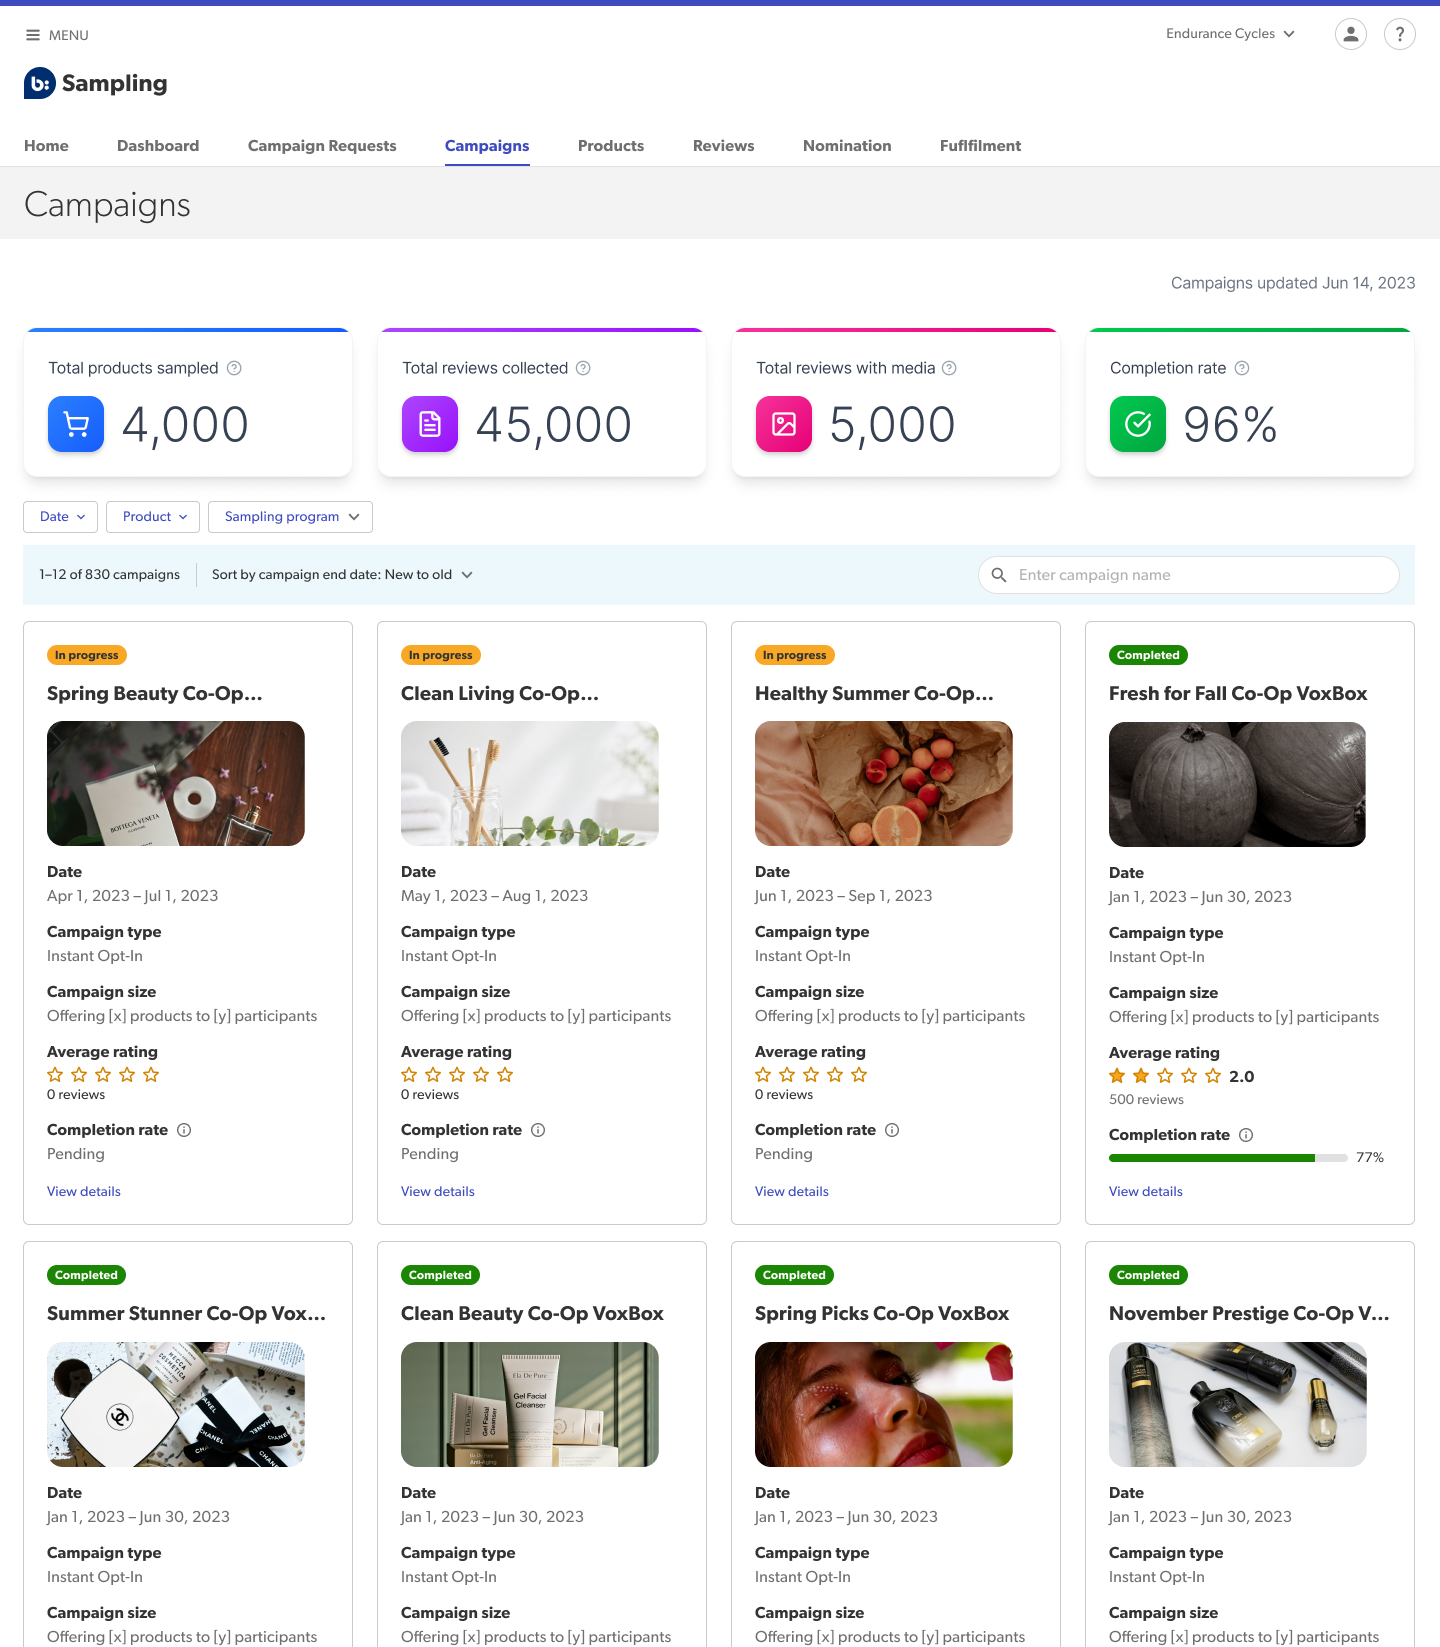
Landing page
Clients can see all campaigns either in progress or completed, as well as sort through them. The aggregate statistics shown in the cards reflect the total across all campaigns related to the instance.
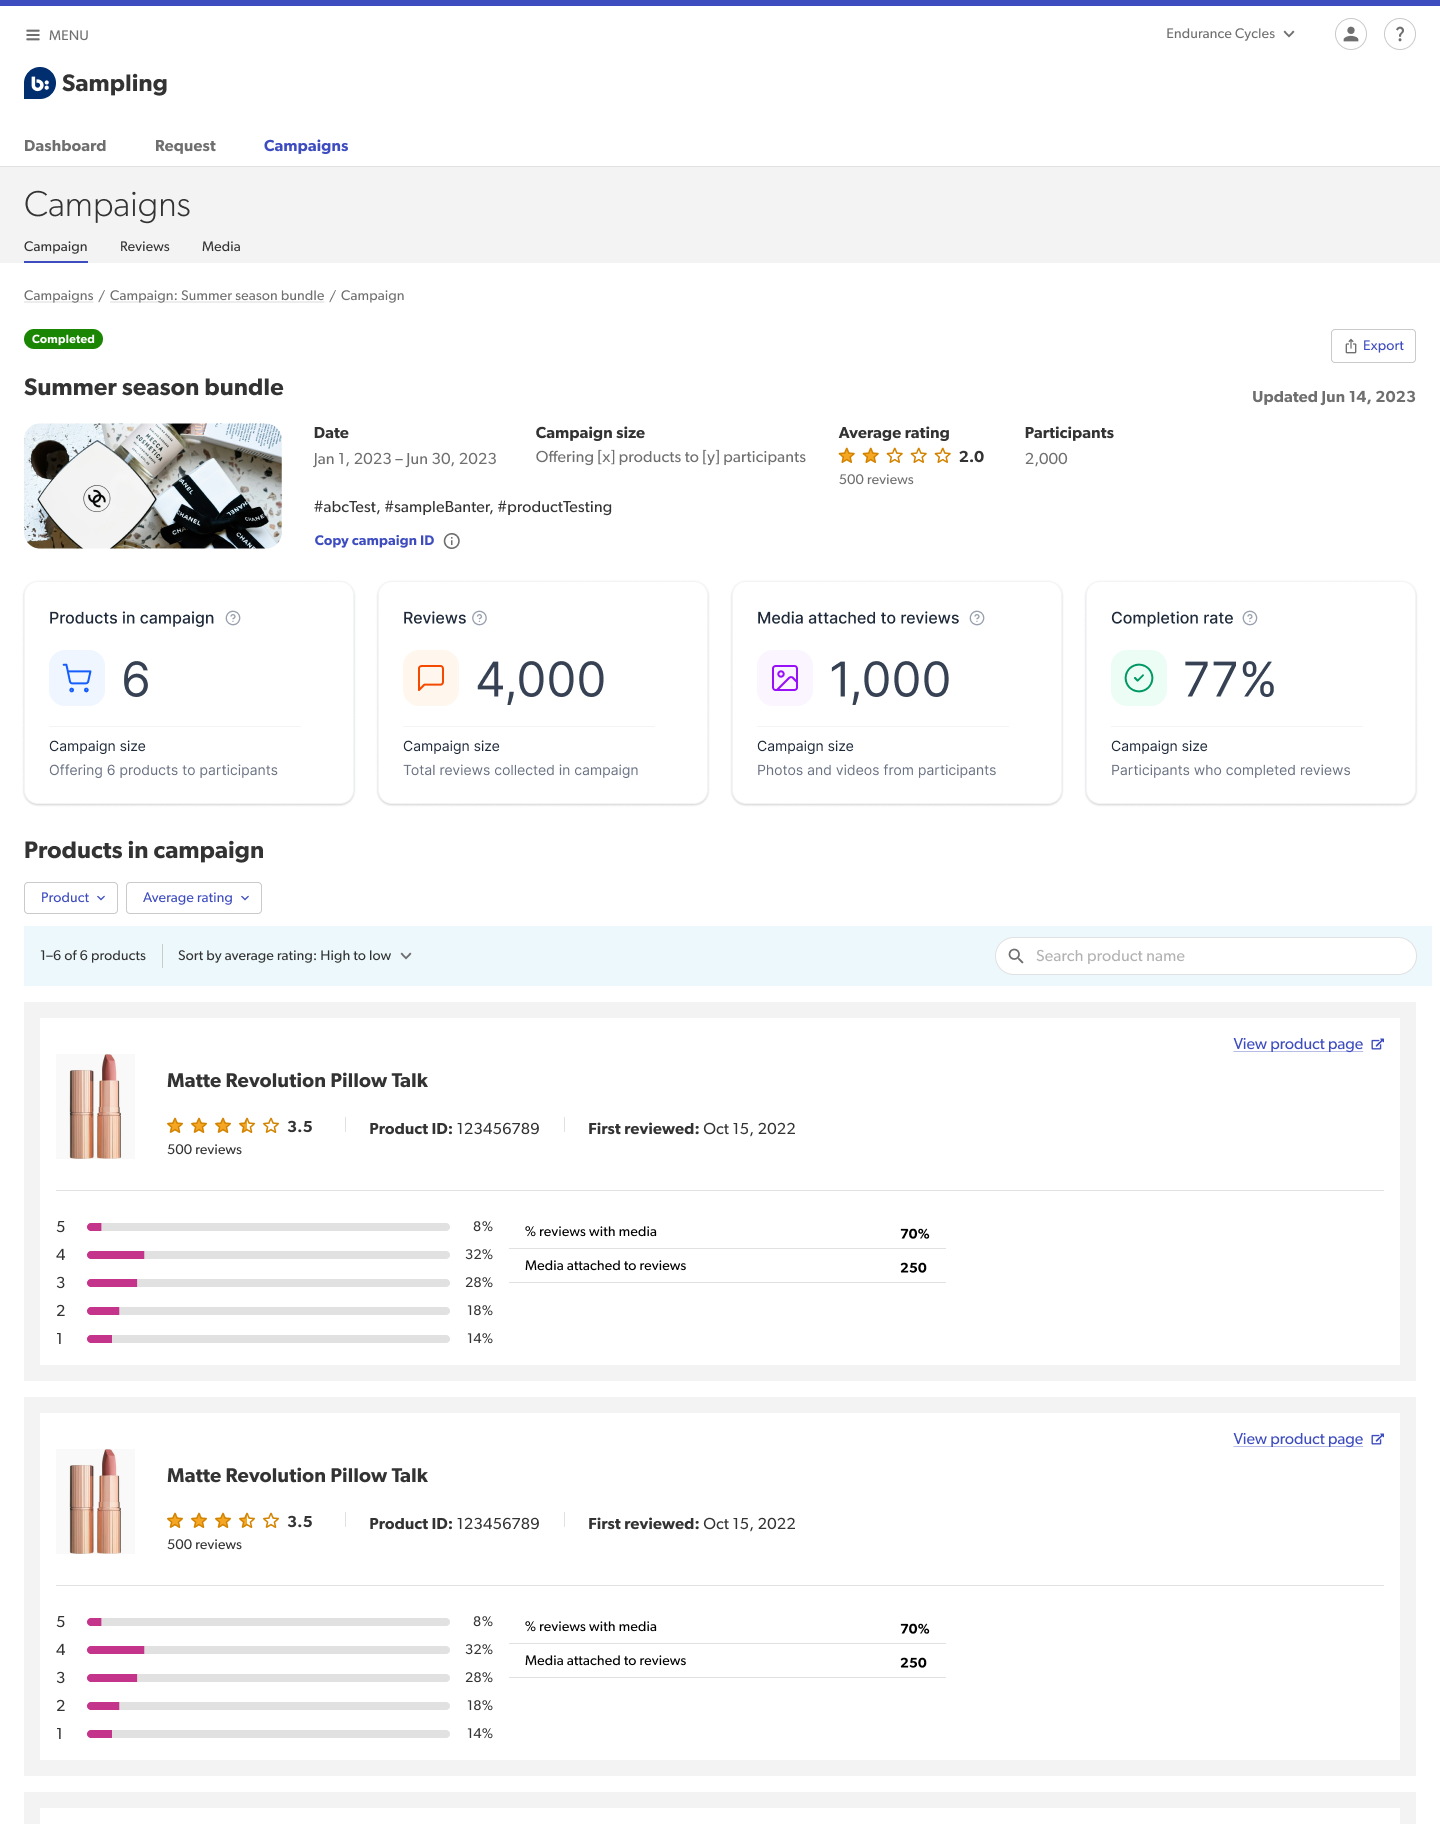
Campaign view: Overview
Clients are able to view individual campaigns in detail.
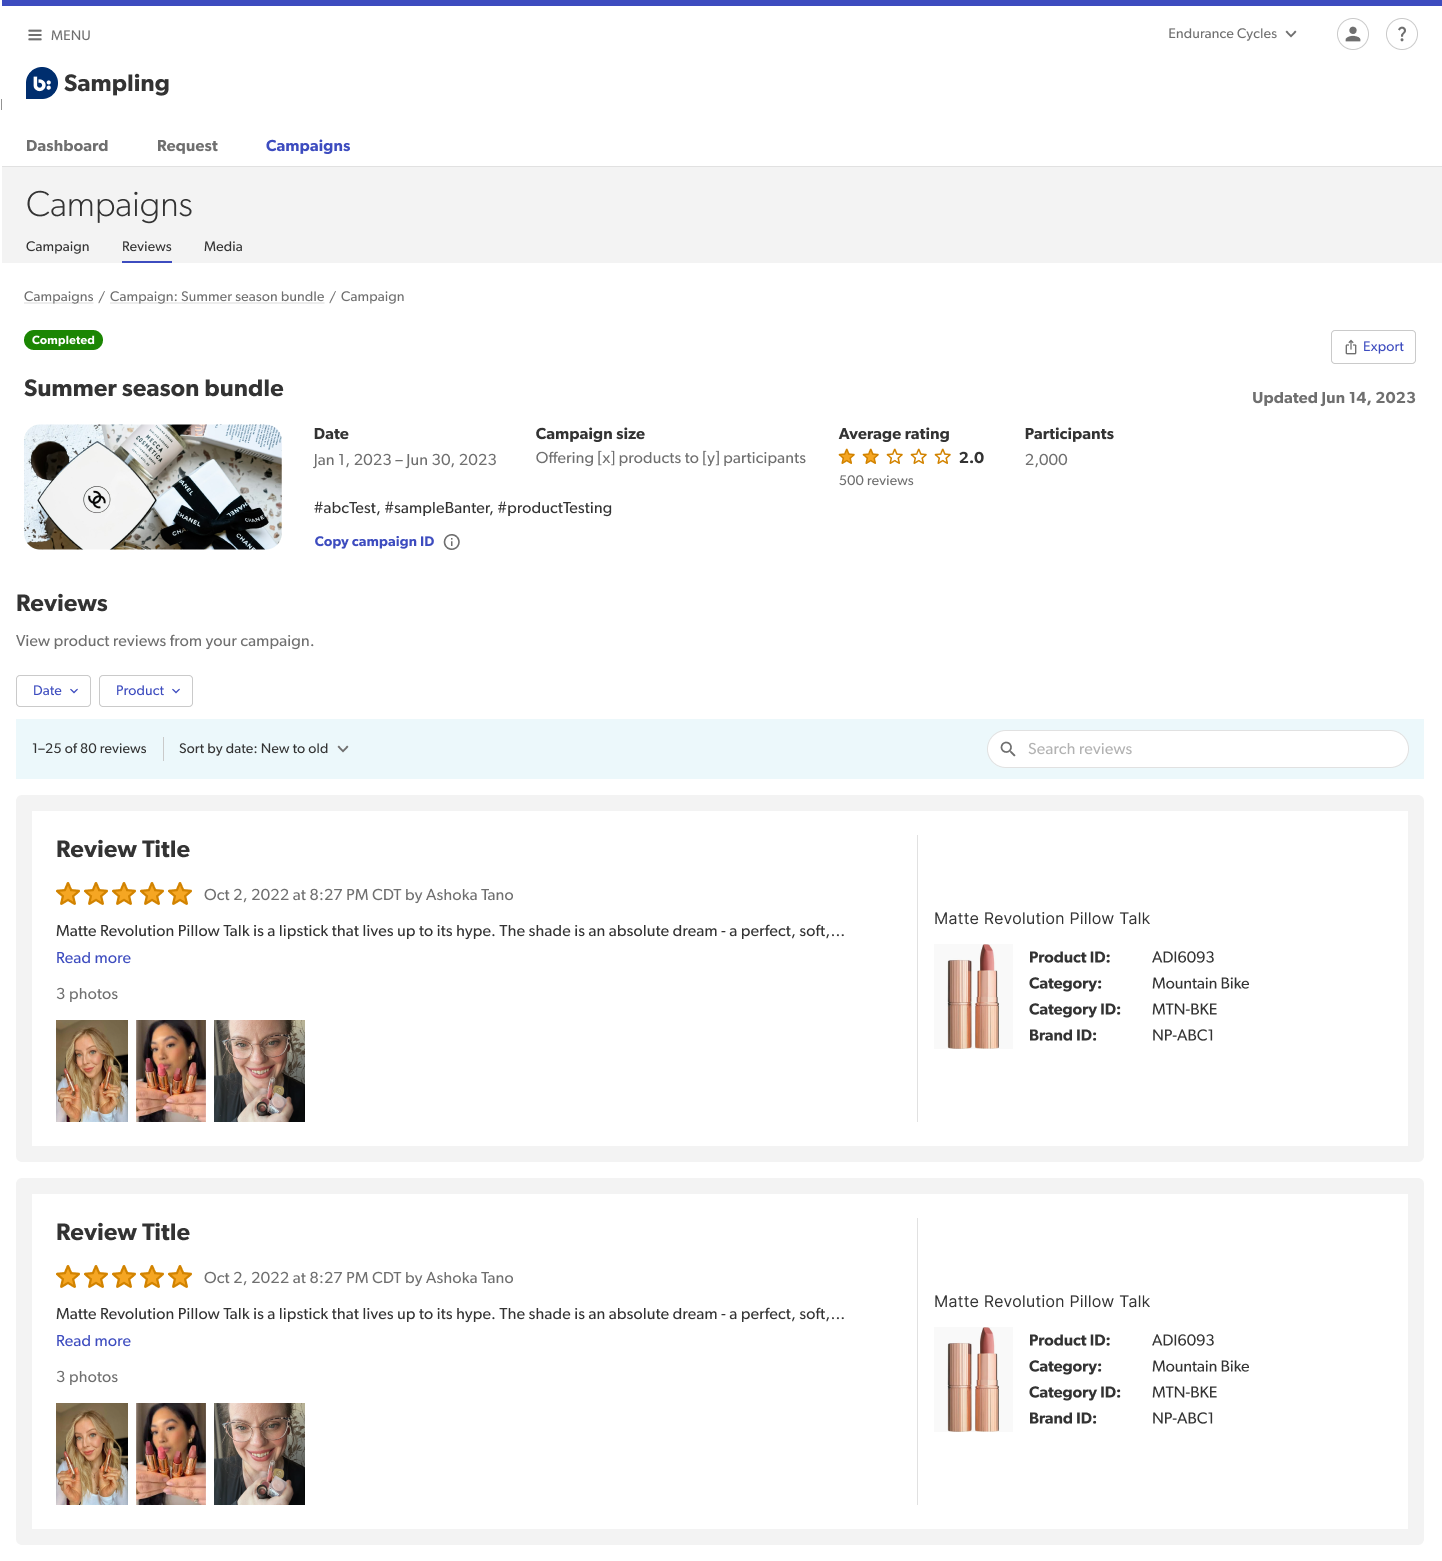
Campaign view: Reviews
Clients can scroll through and filter reviews left per campaign: they can filter by Date or Product.
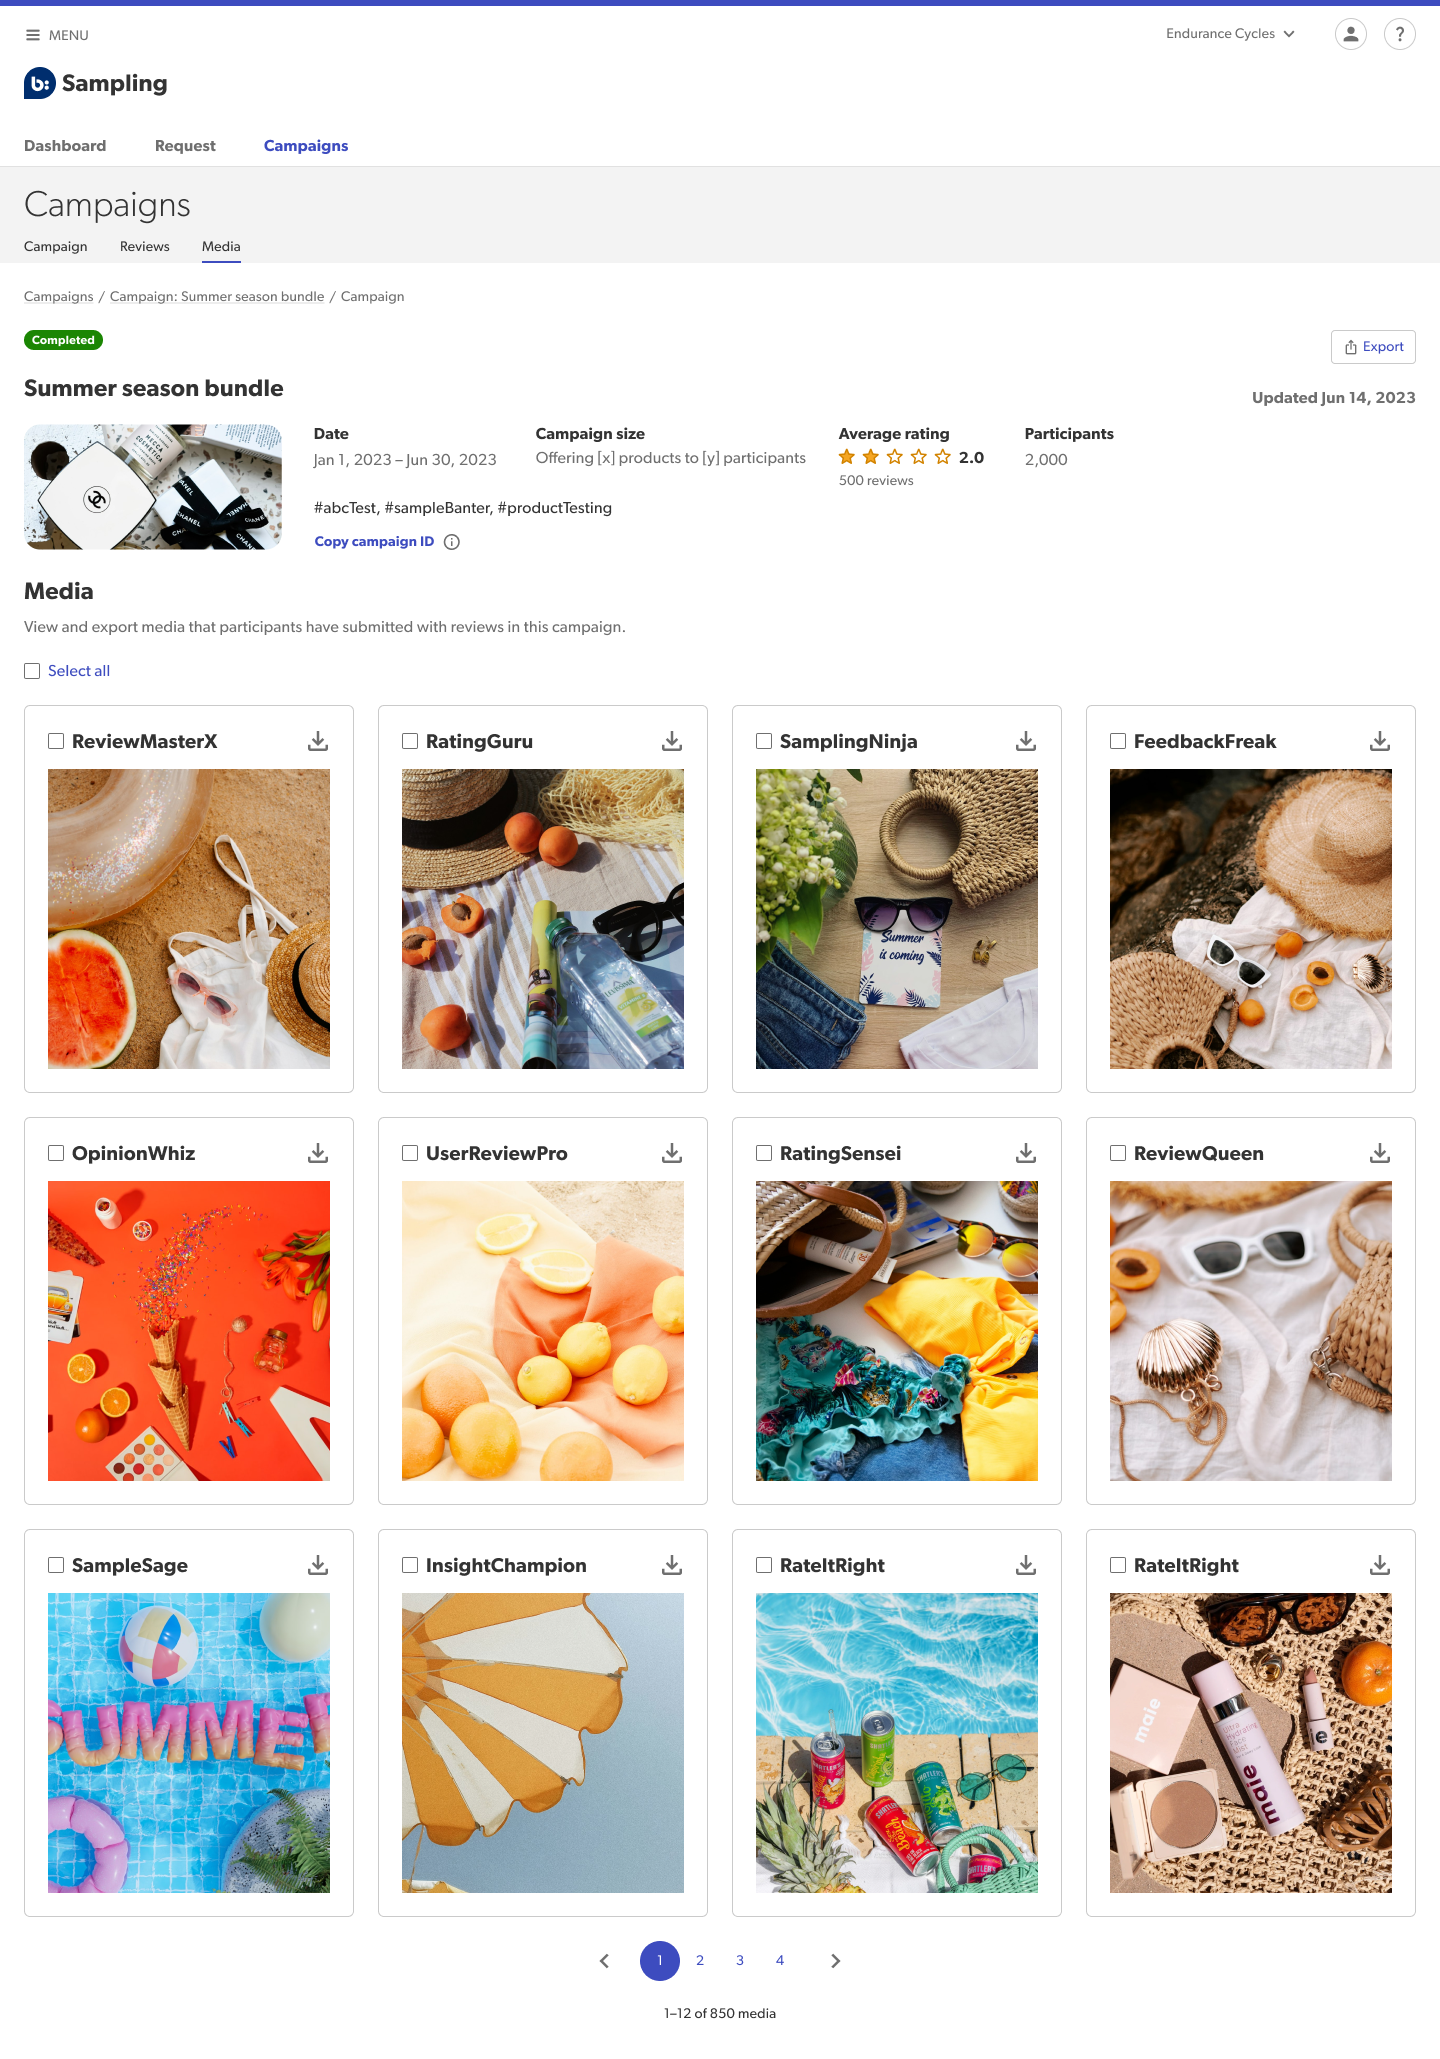
Campaign view: Media
Clients can view all media attached to reviews through this media gallery. They can use a bulk actions pattern to download singular media or in bulk.
05. Results and Learnings
Real-time visibility is a baseline expectation
Clients expect to track campaign progress as it happens. This allows them to proactively update internal teams and make adjustments mid-campaign, such as refining audience demographics if review quality is falling short.
Outcomes matter more than setup
Clients care most about what the campaign achieved, not how it was configured. Because they build the campaigns themselves, they want quick access to results and performance, rather than product-level settings or setup details.
Clear metrics beat narrative insights
Clients consistently preferred direct, quantitative statistics over descriptive storytelling. Data needs to be easy to scan, quick to interpret and suitable for fast decision-making.
Clear campaign status reduces mental effort
Being able to clearly separate In Progress and Completed campaigns helps clients focus on what needs action and what is ready for review. This reduces cognitive load and improves efficiency.
Executive-ready outputs are essential
Clients need downloadable, polished PDFs to share internally. These reports are critical for demonstrating return on investment and proving the value of Sampling campaigns during budget renewals and conversations with senior stakeholders.
Social content is a diagnostic signal
Images and social posts are mainly used to spot potential product issues or quality risks. When deeper social analysis is needed, clients rely on specialist tools such as Traackr. This reinforces that social metrics should support the experience, not dominate it.
Manual reporting does not scale
The current reporting process is time-consuming and admin-heavy. It slows down insight delivery and negatively impacts client perception. This creates a clear opportunity to automate reporting and move towards a more scalable, self-serve model.